Take a look at a map, either online or on paper. Which do you think is bigger: Greenland or the African continent? If you were looking at the common rectangular map, it would appear that Greenland is the same or slightly bigger than Africa. However, the actual surface area of the African continent spans about fourteen times larger than Greenland. To remedy this inaccurate geographical representation, the United Nations held a vote this September to encourage greater use of the Equal Earth projection over the currently dominant Mercator projection. Both of these aim to present the earth on paper maps, but the Mercator projection makes high-latitude regions of the world look disproportionately larger than their actual sizes. The Equal Earth projection, as the name suggests, was proposed as an alternative in hopes of more accurately preserving the relative area of each region of the Earth. The slight issue is: neither maps are fully accurate.
Mercator maps look disproportionate because of mathematical limitations. Earth is shaped like a sphere — a curved 3-dimensional figure, whereas the maps we use are a 2-dimensional projection of that sphere. Therefore, it is physically impossible to create a flat map where every aspect of the Earth is flawlessly represented. Thus, upon developing Mercator projection in 1569, the map prioritized maximizing convenience for sailors. It allowed them to plot routes with the same compass bearing as a straight line, making navigation significantly easier.
In doing so, the Mercator projection warped the spherical Earth into a rectangular image, exaggerating the size of the polar regions. Simply put, the Mercator Projection stretched the round curve of the Earth to form rectangles and turned the polar points into a much wider line. On the other hand, the equatorial regions remained unaffected.This disproportionate scaling is why Greenland looks so big, even comparable to Africa, on our commonly found maps.
The Equal Earth projection aims to resolve this issue by making every longitude evenly spaced. However, it also sacrifices some aspects of Earth’s shape and distance. As mentioned before, no 2-D map in existence can perfectly represent the spherical Earth. Each chooses what information to prioritize and what to sacrifice.
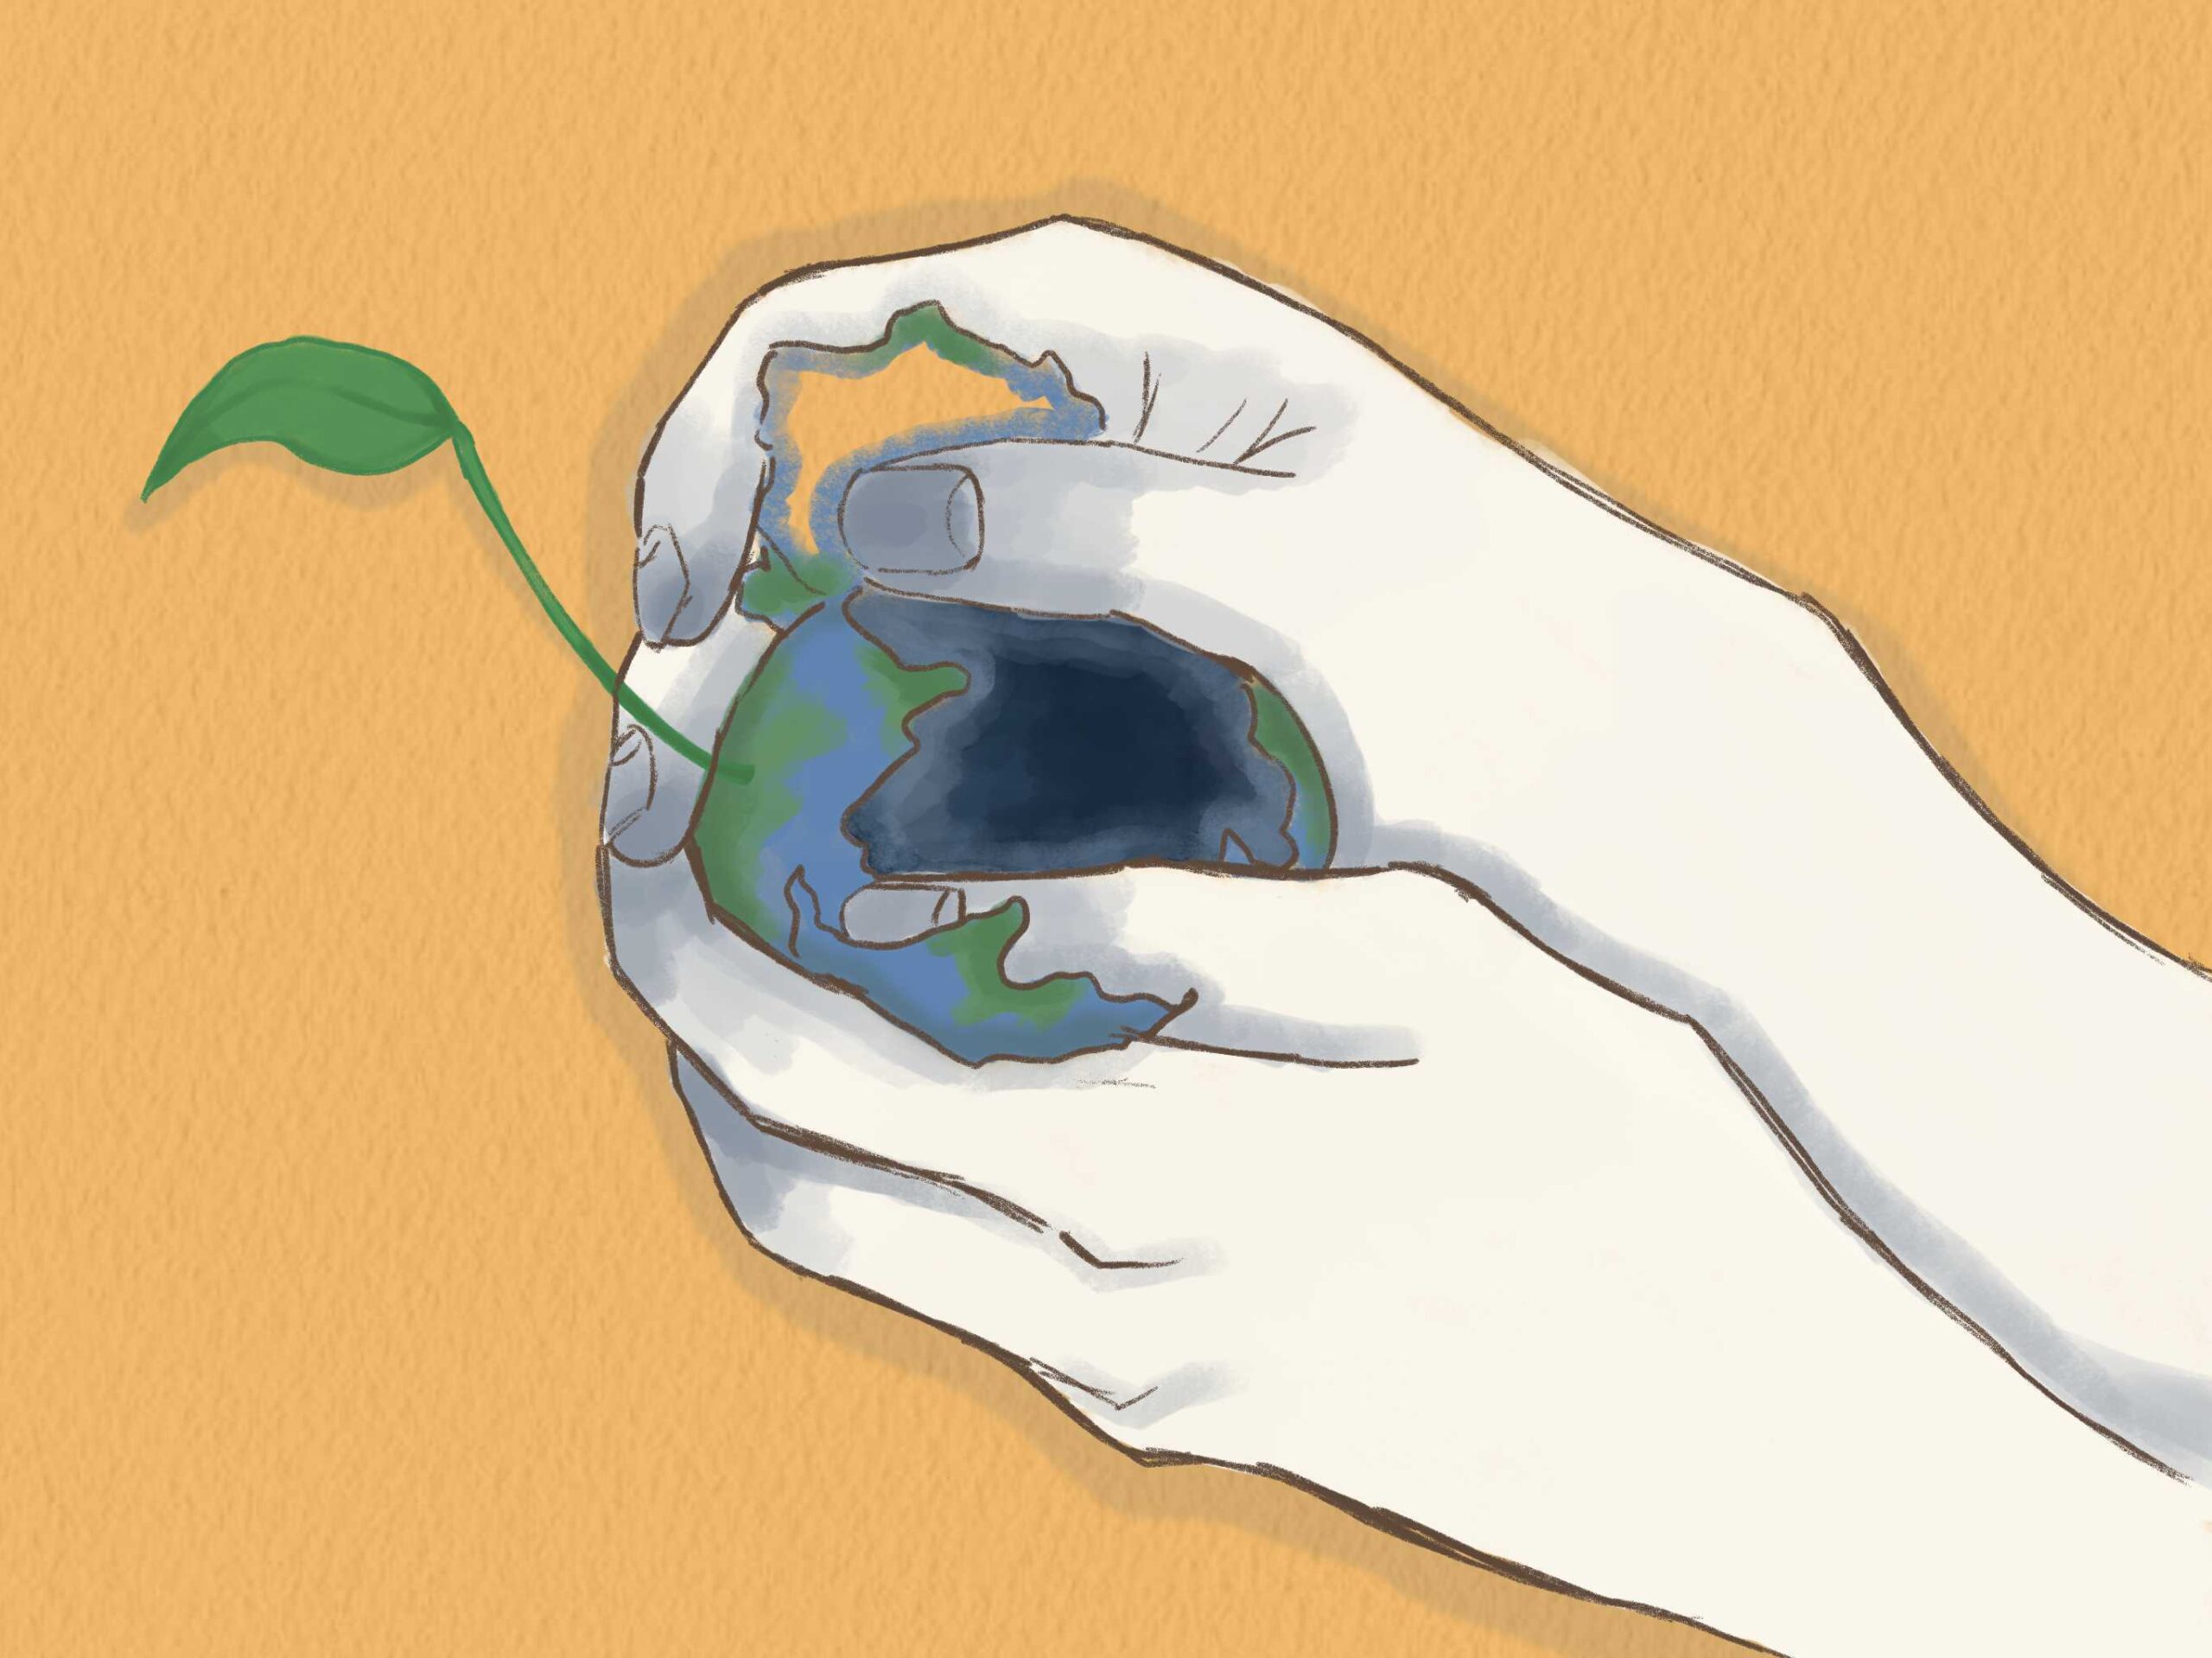
As I learned about this topic I realized that maps aren’t the only representations of reality that have to make similar choices. For example, a history textbook may omit crucial context for concision or unintentionally include misleading wordings. A news article may choose not to include every detail of current world issues. Social media posts may also either intentionally or unintentionally crop a quote from a famous figure to substantiate a particular argument.
Consider for example, a headline or history reading that briefly explains that “country A invaded country B.” The statement could entirely be true. But depending on whether the reader has context about the prior conflicts, diplomatic issues, economic pressures, or attacks by other countries, their understanding may also similarly be different.
These omissions can be important. Effective communication often cannot be achieved when we try to include every small bit of context. Conventional word limits may be enforced for journalists writing news articles; history readings cannot exceed a certain amount for students to fully digest the information. Choices and sacrifices are inevitable, with or without our knowledge; however the importance lies in recognizing that fact. Consciously acknowledging that we are often not presented with the entire context can slow down our impulse to make premature judgments. Instead, we need to ask what may be missing and consider how that missing information could change our understanding. Like a map, the information we receive is merely a representation of reality — not reality itself.